全国咨询电话
0760-887298992020-11-07 15:09:05 编辑:无 浏览:(1881次)
2020年11月份雅思小作文预测
小作文预测题目
由于近期的考试中流程图和地图题接连出现,因此在本月考试中数据类型题目是备考重点。数据表现形式以柱图作为备考的要点。此外,流程图也应该在备考中被重视起来。
1.静态图(柱图)


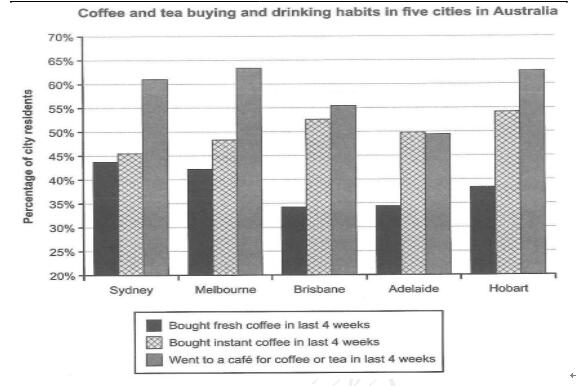
The statistics (measured as a percentage) of people’s drinking and buying habits on coffee and tea in five Australian cities from a survey is indicated by this bar chart.
To begin with, 44% residents in Sydney bought fresh coffee in last 4 weeks, a bit higher than Melbourne (43%) and Hobart (38%) respectively. Nearly 35% of people living in Adelaide did the same thing, slightly more than Brisbane (34%).
Additionally, in terms of those who bought instant coffee in last 4 weeks, figures of all five cities are higher than 45%, with Hobart accounting for the highest proportion at 54%, followed by Brisbane (53%), Adelaide (50%), Melbourne (48%) and Sydney (46%) in a decreasing order.
More interestingly, as for people who went to a café for coffee or tea in last 4 weeks, proportions of 4 cities are more than a half, with Melbourne occupying the largest percentage at 64%, Hobart 63%, Sydney 61%, and Brisbane a little more than 55%. Meanwhile, the figure of Adelaide is a slightly lower than 50%.
In summary, in 4 cities excluding Adelaide, the most popular habit is going to a café for coffee or tea since related figures are noticeably higher than the other two options. In the meantime, in Adelaide instant coffee is prevalent because almost half local people chose it during last 4 weeks. In contrast, purchasing fresh coffee is the last choice for people in all these 5 cities.
2.动态(柱图)


(an example of a very good answer from C9 T2)
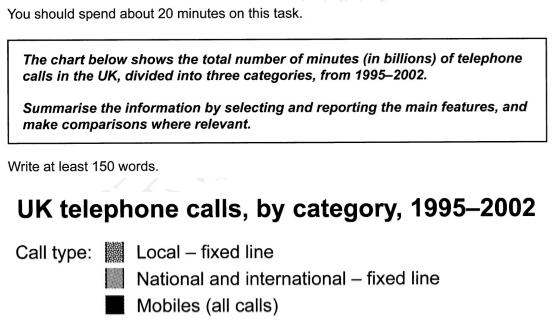
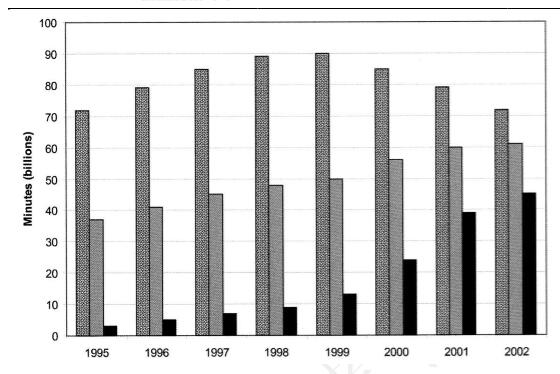
The chart shows the time spent by UK residents on different types of telephone calls between 1995 and 2002. Local fixed line calls were the highest throughout the period, rising from 72 billion minutes in 1995 to just under 90 billion in 1998. After peaking at 90 billion the following year, these calls had fallen back to the 1995 figure by 2002.
National and international fixed line calls grew steadily from 38 billion to 61 billion at the end of the period in question, though the growth slowed over the last two years.
There was a dramatic increase in mobile calls from 2 billion to 46 billion minutes. This rise was particularly noticeable between 1999 and 2002, during which time the use of mobile phone tripled.
To sum up, although local fixed line calls were still the most popular in 2002, the gap between the three categories had narrowed considerably over the second half of the period in question.
3.流程图

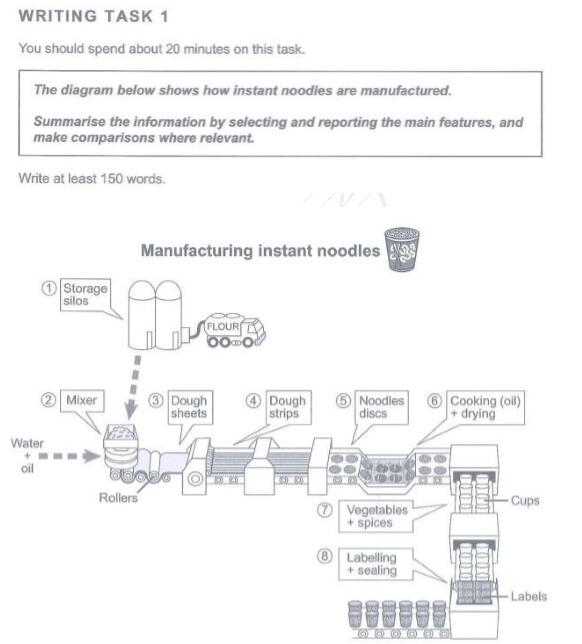
It is illustrated by this flow chart how instant noodles are produced in the production line. The whole process includes 8 clear steps.
In the first step, flour is transported to storage silos by trucks, and then it is mixed with water and oil in a mixer. Going through rollers, the mixture becomes dough sheets, which will be cut into dough strips and then processed into noodles discs over the next two steps. Thereafter, these discs are ready to be fried by cooking oil and then will be dried. In the next step, each dried disc will be put into a cup and then covered by some vegetables and spices. In the last step, those cups are labelled and sealed. Finally, the whole process is completed by those instant cup noodles being packaged.
In summary, for the production of instant noodles, flour, water, oil, vegetables, and some spices should be prepared as ingredients and seasoning. Meanwhile, after flour, oil and water is mixed, the dough will be rolled into sheets, cut into stripes, processed into discs, and deep fried. Subsequently, dried noodles discs will at last be packaged with some condiments.
北京环球天下教育科技有限公司 版权所有 客服信箱:Marketing@gedu.org
联系电话:0760-88729899 Copyright © 1997-2017 Global Education. All rights reserved.